
Trawl 3.2: Watch Every Scraper, Know Why a Run Failed
See every scraper on one page, know why a run failed and what Trawl did about it, and let a wizard that tests first build your next one. Live now, nothing to turn on.


Trawl already watches your scrapers and repairs them when a website changes. With 3.2, you see all of it on one page, and every run tells you what happened. The wizard that builds your scrapers also takes the shortest road to a working result.
In short, this release brings:
- 📊 Every scraper on one page: success rate, rows delivered, runs per day and a day-by-day map of each scraper.
- 🔍 Runs that explain themselves: the cause, what Trawl did about it, and whether the next run confirmed the fix.
- ⚡ A wizard that tests first: it tries its first script right away and hands it over as soon as your data is complete.
Live now on the web app, the API (v3.2.0) and the CLI (3.12.7). Nothing to turn on: every account has it.
Every scraper on one page
Open Monitoring and you see how all your scrapers are doing at a glance: the success rate, the rows they delivered, the runs per day and the failures sorted by cause. A map shows each scraper day by day, green when it worked, so a bad week stands out in a second.
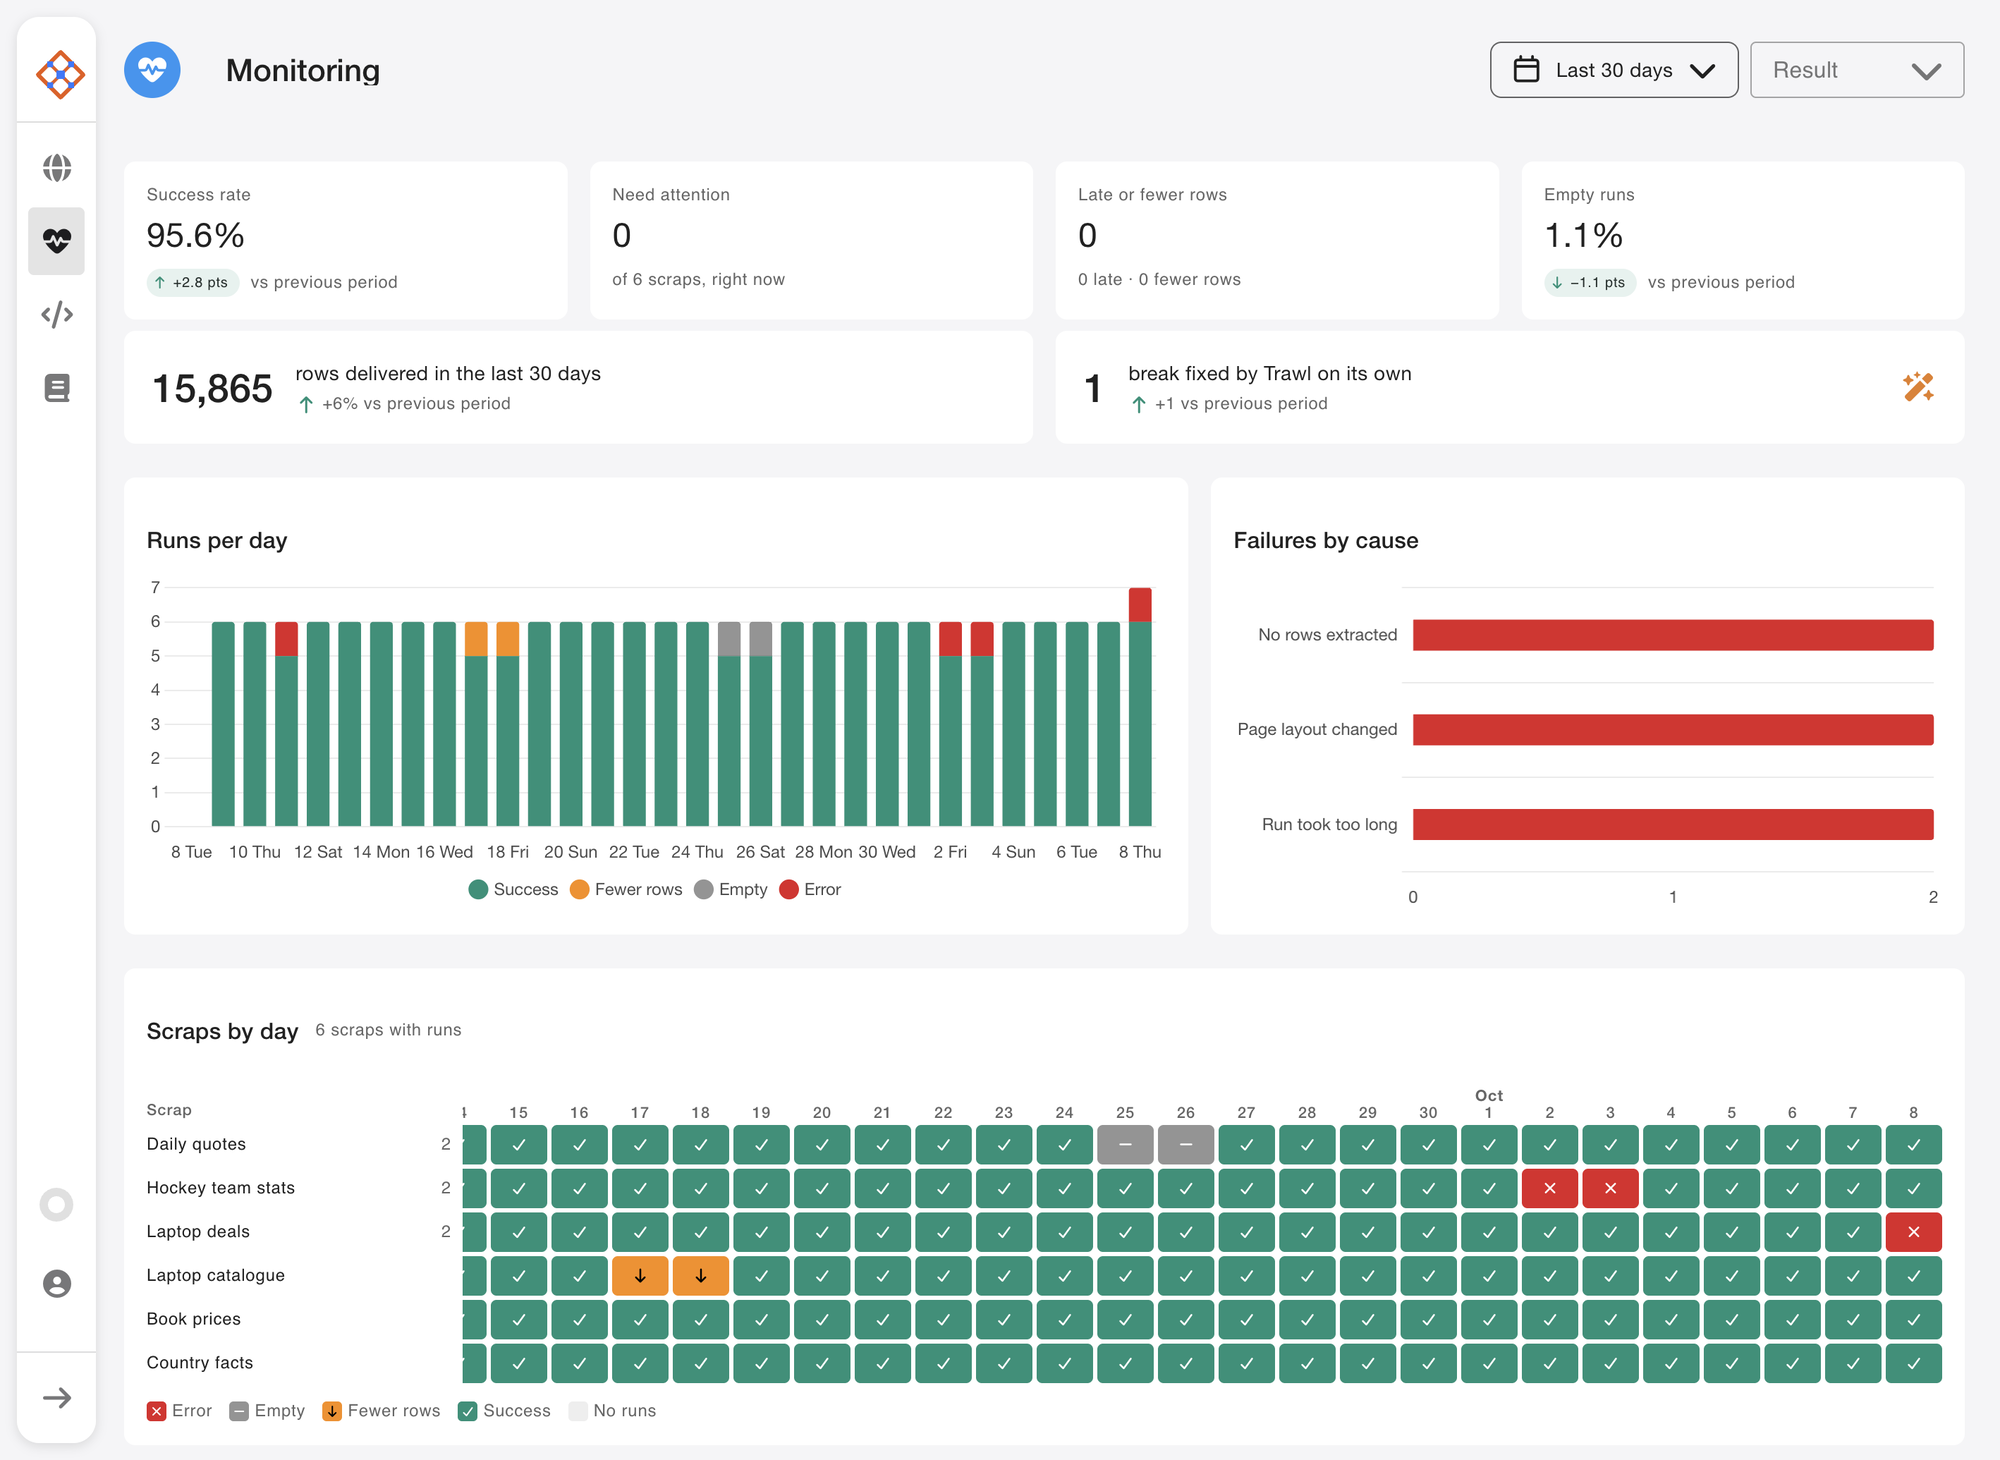
Most numbers compare themselves with the period before, so you can tell a good month from a lucky day. The two tiles on the second row count what matters most: the rows your scrapers delivered, and the breaks Trawl fixed on its own.
Each square on the map is one scraper on one day. Click it and you land on that run. Pick a period or a result at the top, and open any scraper's History tab to get the same page, narrowed to that scraper.
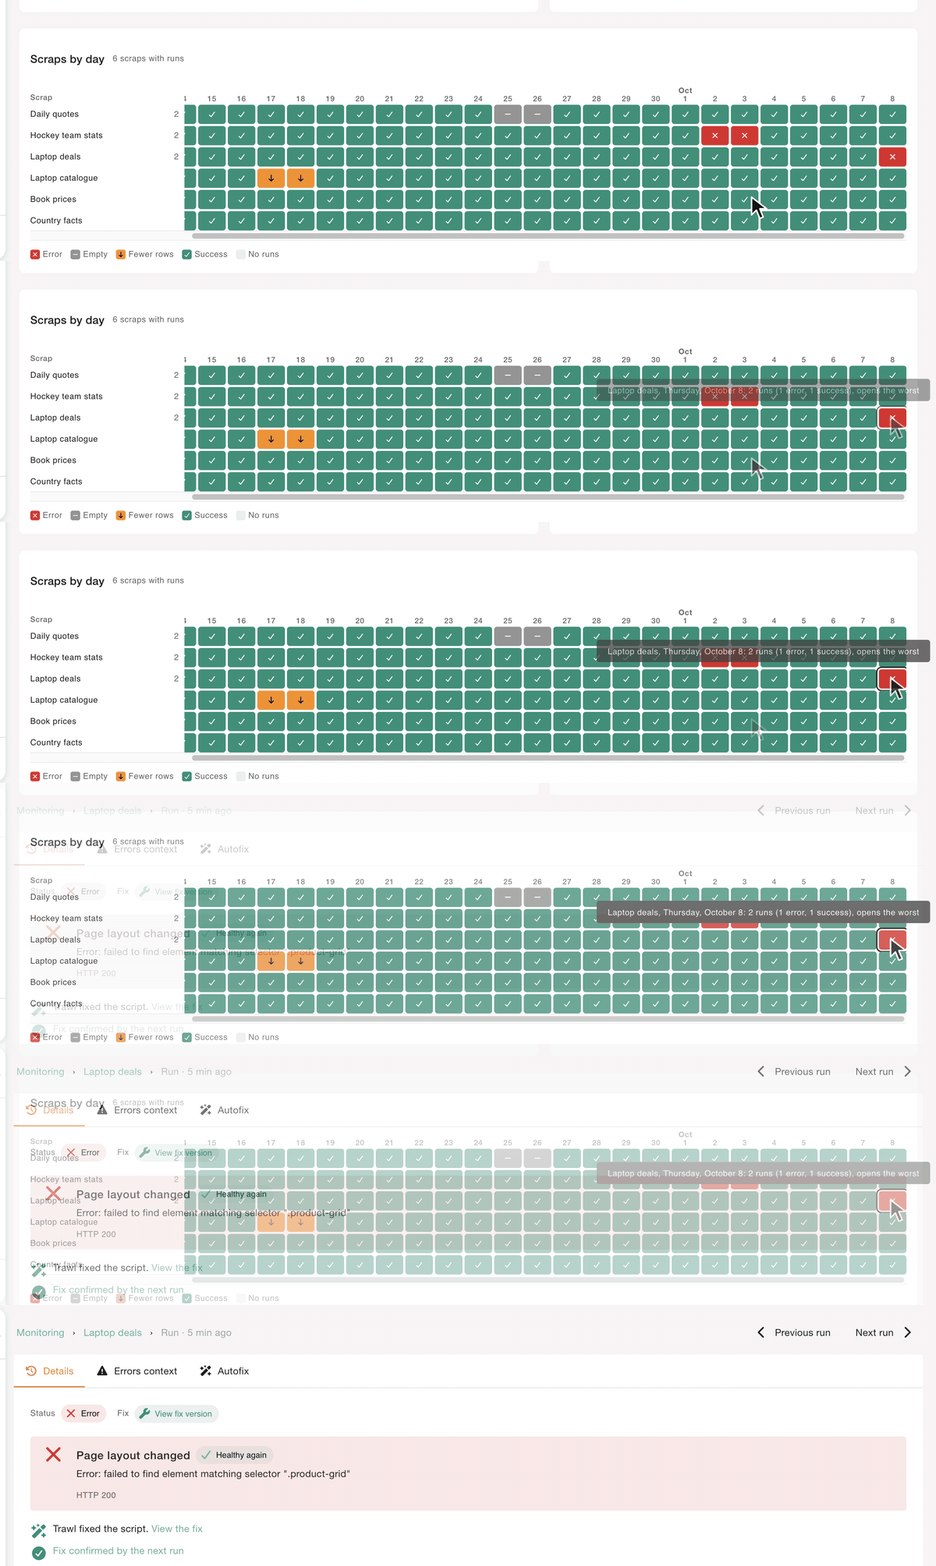
It works alongside the alerts you already have: a scraper that keeps failing pauses itself and tells you, and Monitoring shows you where it sits among the others.
Every run tells you why
Open any run and the first thing you read is the reason, in plain words: the page layout changed, the site asked for a login, the run took too long. Right under it, Trawl says what it did about it and whether the next run confirmed the fix.
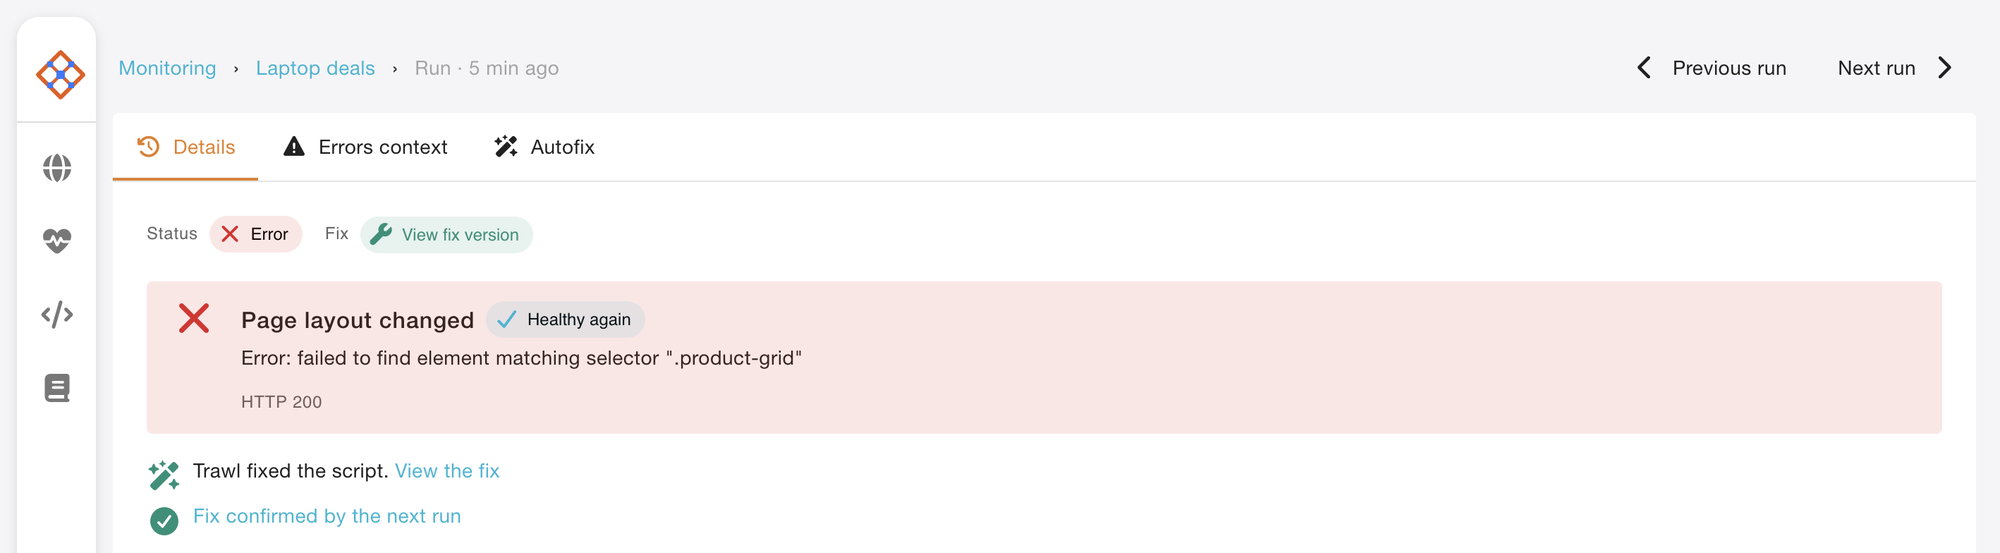
That is the repair agent from 3.1 at work, and the run page is where you see it. The same page shows the rows it got compared with a usual run, the inputs it used (secrets hidden), the snapshot of the page, and buttons to step to the previous or next run.
Slow pages get their own cause too. A run has up to ten minutes to finish, and when a page really needs longer, the run names that cause.

For developers: the same answer from the CLI
The cause travels with the run, so a script can read it too. Here is the run from the screenshot above:
trawl run-info 6ac7a71699dcf367b1b86d20 --json{
"status": "error",
"failureKind": "selector",
"selector": ".product-grid",
"tier": "tier1",
"emptyContext": {
"selectors": {
".product-grid": 0,
".product-tile": 0
},
"page": { "totalAnchors": 169 }
}
}failureKind takes values such as block, auth, selector, timeout, nav and empty. emptyContext lists the selectors that matched nothing, so a deploy script can tell "the site changed" from "the site was down" before it pages anyone. Trimmed: the full response also carries the error message, the run time and the date.
See it on your own scrapers: open Monitoring and click the reddest square you can find. Try Trawl free.
The wizard tests first
Describe the page and the data you want, and the wizard writes your scraper. It tests that first script right away and hands it over the moment your data comes back complete. It only reaches for extra help, like a recipe for the shop's platform or a look at another page, when a test fails or comes back short.
It knows the common shop platforms (Shopify, Salesforce Commerce Cloud, PrestaShop) and keeps a recipe for each, so it already knows where prices and stock usually sit. On a well-known shop that path is built to take just a couple of steps, and a tricky site still gets the full toolbox, with up to fifteen minutes to get it right.
For developers: how the wizard picks its next step
- Test first: the first generated script goes straight to a real dry run. Recipes, page reads, URL fetches and navigation come into play only after a failing or short test.
- Recipe up front: the detected platform's recipe goes into the first script, except on Shopify, where the wizard asks for it only when a test calls for it.
- A clean finish: when the wizard reaches its last test, it gets one final turn to finish with the best script it has.
- CLI 3.12.7:
trawl createprints a warning when the wizard could not confirm its own script (verified: false), so you know to check the rows before you rely on them.
Digests that compare with last time
Your digest email reads like a short newsletter: a few sections, one line per change, and a look back at the previous run, so you see what moved since last time without opening the data.
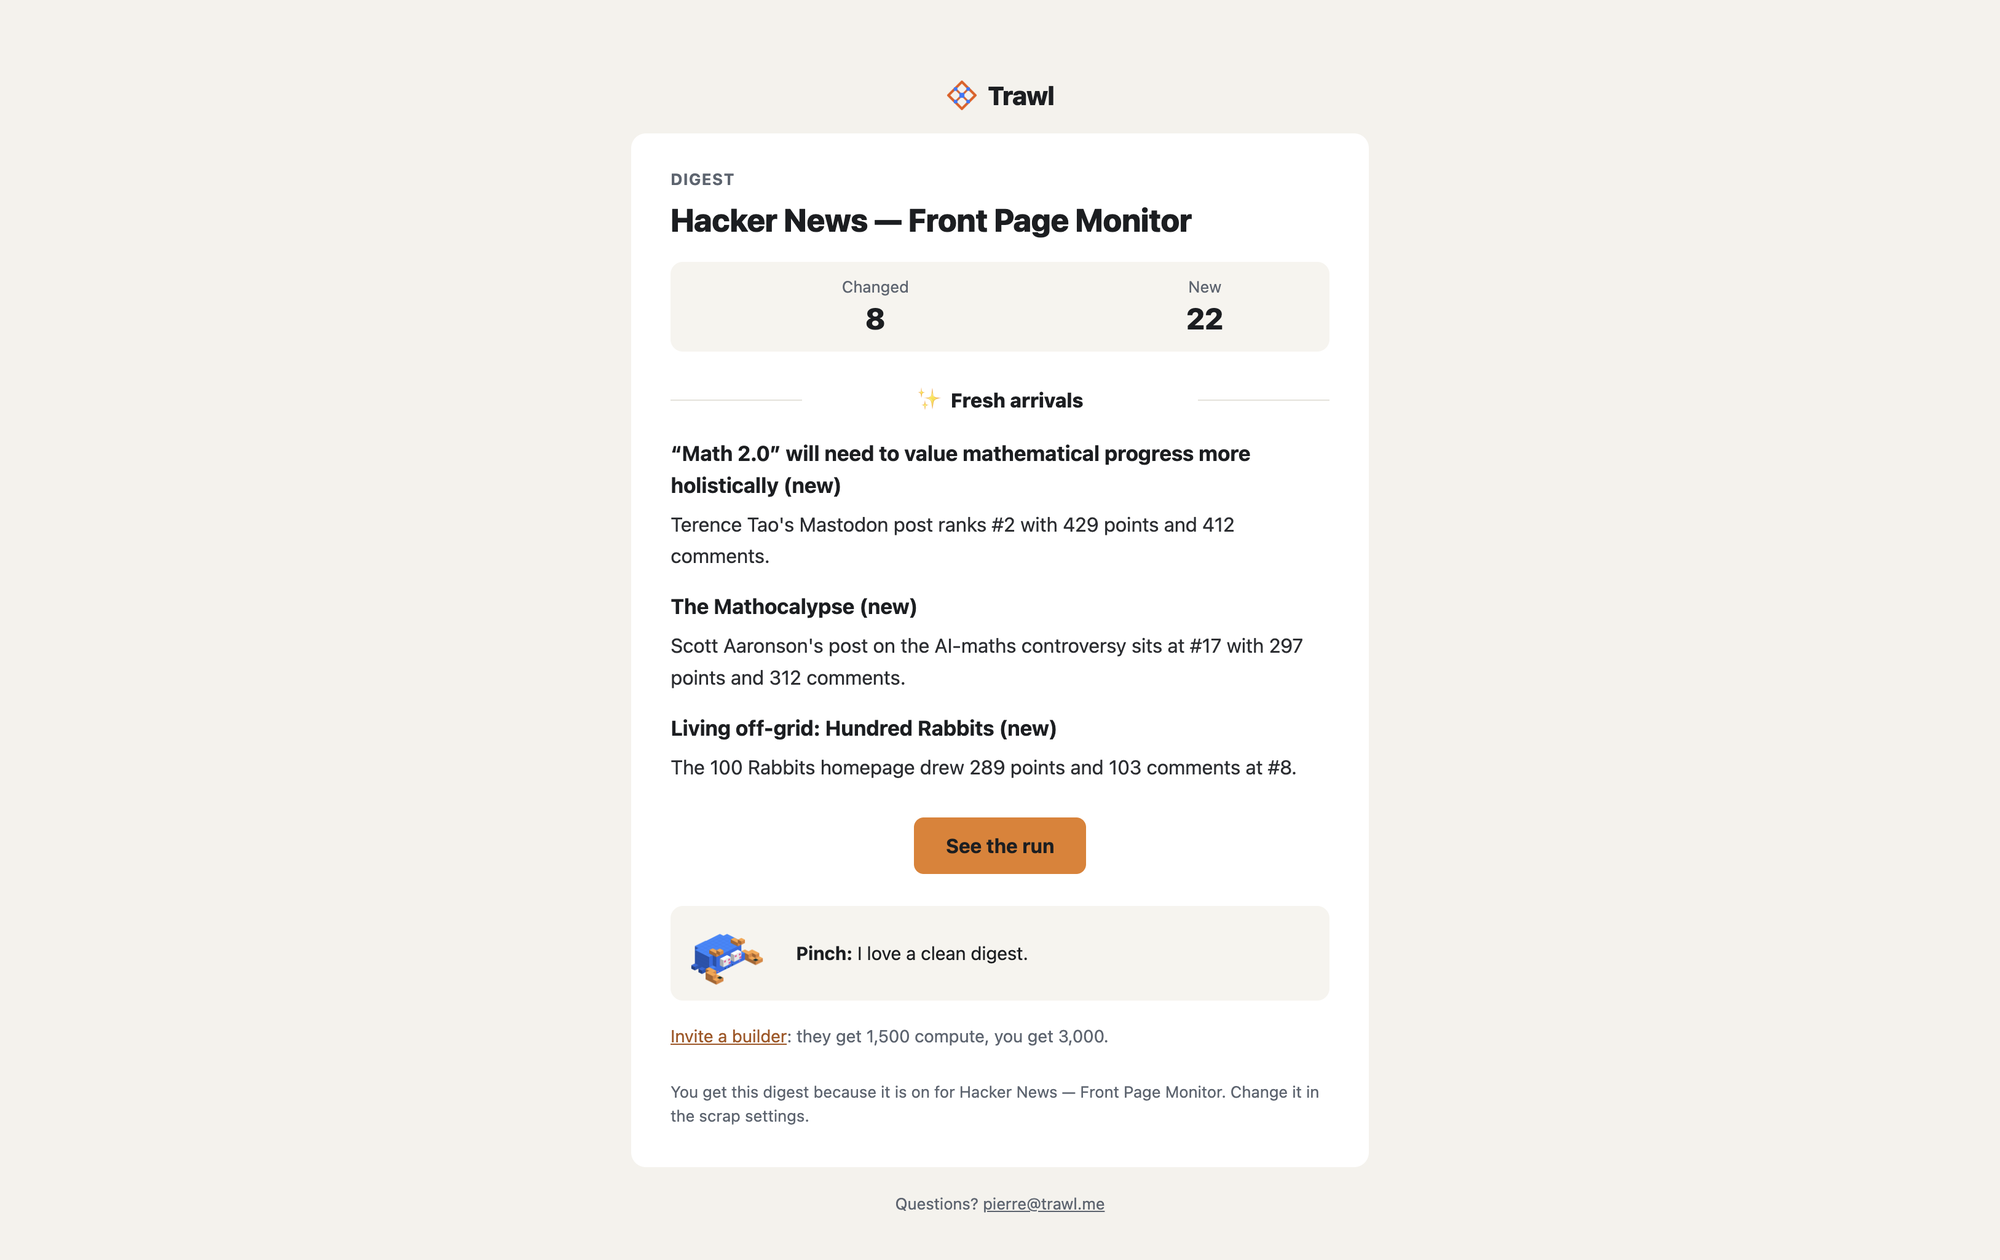
Turn it on for any scraper and pick who receives it. Trawl writes it from the fresh result and the one before it, and keeps the links in it safe to click.
Also new
- ⚙️ Platform · A new look for every email: alerts, digests and account mails share one clean design, with Pinch along for the ride.
- ⚙️ Platform · A welcome tour: new accounts get three short mails over their first three weeks: a first scraper in two minutes, letting your AI agent drive Trawl, and scrapers that fix themselves.
- 🌐 Web app · Sign-in keeps your place: open a link to a scraper while signed out, sign in, and you land on that scraper.
- 🔒 Security · Sandboxed page snapshots: the saved copy of a page opens in its own sandbox.
Your scrapers keep working while you look elsewhere. When one stumbles, Trawl tells you why, repairs what it can and shows you the proof on one page. Point it at a site you care about and see the month fill up.
Written by Pierre | October 2026